A Very Basic Intro to D3
What is it?
D3 is a JavaScript library for data visualization.
Why should I learn it?
If you want to do more advanced data presentations than you can accomplish with the Google Charts API or other charting packages, D3 allows you to create very customized visualizations.
What can I do with it?
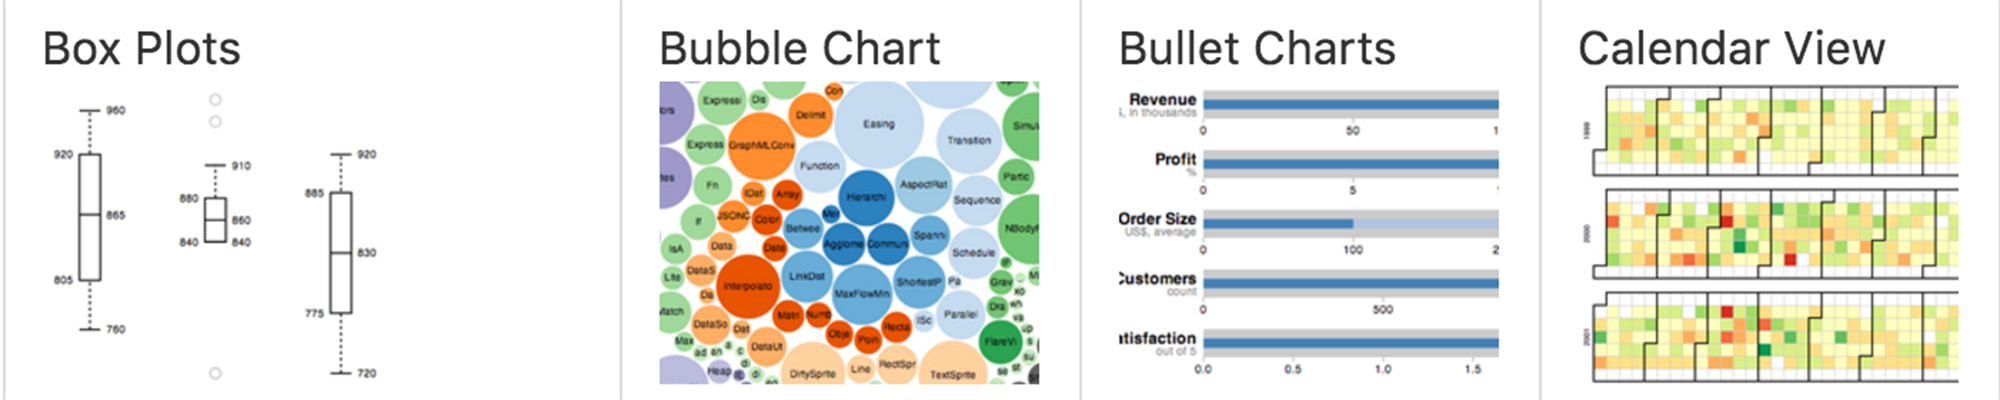
Bar charts, line graphs, scatterplots and more. D3 allows you to fully customize the presentation by binding data to shapes.
How long will it take?
D3 is a complex topic. It will take a lot of practice to become proficient at using it. These examples below provide a very brief introduction to using D3. Use the resources to continue learning about and applying D3 to your own projects.
Getting Started
This series of exercises will introduce the D3.js library and provide the basis for continued learning and application in your own projects. This will show you how to get started doing more advanced visualizations incorporating data. D3 is a JavaScript library that uses HTML, CSS and an image format called SVG (scalable vector graphics). It is able to run in most modern browsers, just as JavaScript and JQuery do. D3 was developed by Mike Bostock during his Ph.D. studies at the Stanford Visualization Group. He worked in graphic design for The New York Times, but left in 2015 to focus on developing open-source projects.
Just like JQuery, D3 requires access to a js file for the library. You can download the library and reference it locally, or you can link to it on the web. Put this in the head of your document. Your code will then go within the script tag in your document, just like JavaScript.
D3 uses the UTF-8 character set, so it may also be necessary to include a reference to handle that in the head of the document.
The SVG format allows for the creation of two dimensional vector graphics, as opposed to images created with pixels. With start and end paths and points, angles and curves, images are able to be easily scaled to larger or smaller sizes. SVG comes with image formats for rectangle, circle, ellipse, line, polyline and polygon.
To create an SVG, you use the svg html tag and surround a shape tag. SVG and associated shapes have attributes for height, width, placement and fill.
D3 uses several methods and operators that you will see as you progress through the examples below.
- .select - the Select method uses CSS3 to select DOM elements, much like we have done in JavaScript with document.getElementById. The code below selects an element with the class "chart".
- .append - appends a new element in the current selection. This allows you to programmatically add elements based on data. The code below appends a div within a "chart" element.
- .selectAll - selects all the elements that match the selector. The select method only chooses the first element.
- .data - you bind data to a selection using the data operator. Add this to the chaining syntax of the selected element.
- .enter - a virtual selection of the data operator. Once you have this virtual selection, data can be applied to it.
- .text - sets the text content for the selection. This can be used with a function to read from a dataset.
- .attr - allows you to set attributes of a selection - things like width, height and placement
- .style - allows you to set and modify styles of a selection
D3 Chain Syntax - you will notice that D3 uses a chaining syntax for each method call. There is a period in front of every method or operator. The chain continues as long as there are options being applied to the element.
The general process for making a D3 visualization is four steps:
- Bind data
- Add elements
- Update elements
- Exit (if necessary)
Selections can be made into JavaScript variables that can be used throughout your scripts. You will see this technique used in the examples below.
Simple Shape
This example shows you how to create a simple shape in D3. It demonstrates the use of methods and operators using the chaining syntax. D3 does not care about spacing, so you can chain across the line or put each method or operator on a separate line. The D3 statement needs to be ended with a ; (semi-colon).
The example to the right creates a red rectangle within a blue SVG that is appended to the body of the document. Notice the attr and style settings for each that control placement, size and color.
The code to the right creates an element that looks like this: 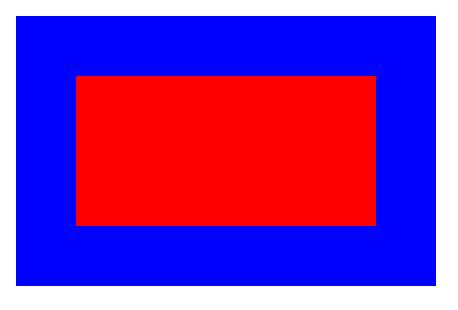
Simple Shape
Binding Data
This simple example shows how to bind data to an element on the page. Notice that this is binding the data as text content to an h2 element in a div named #box.
The variable d in the function below is designed by D3 to refer to the current data for the specific element, identified in the .data line. This will read each element of the data and act on it based on the command, in this case .text.
The code to the right reads the data from an array and returns the following result.
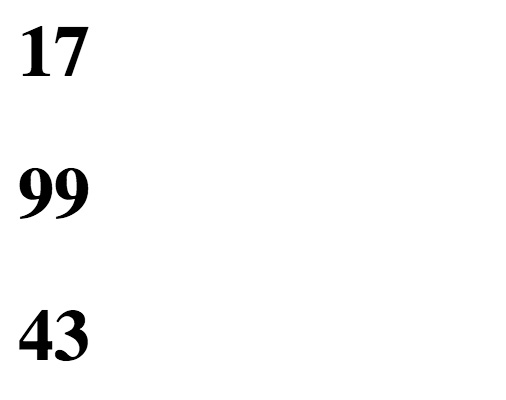
Binding Data
Visualization with Div
Now that you know how to bind data to an element, you can use it to determine the width of an element. This example provides the script to make a simple chart that generates a series of divs whose width is driven by data in the array. Notice the use of CSS styles, the dropdown and JavaScript functions to process the event and value from the dropdown to determine which dataset to use.
The function draw is called to create the chart using the x variable to create the scale and the sel variable to define each step of the d3 process (select, bind data, update and exit). The exit statement is necessary to redraw the chart for subsequent selections of the dropdown.
The scale of the chart is handled simply by multiplying each data element by 10, but you can decide the scale needed by your own data. D3 has some advanced scaling techniques, that we won't be covering in this exercise, to create linear and ordinal scales that can be customized to generate automatically based on characteristics of your dataset.
The code to the right creates the following chart.
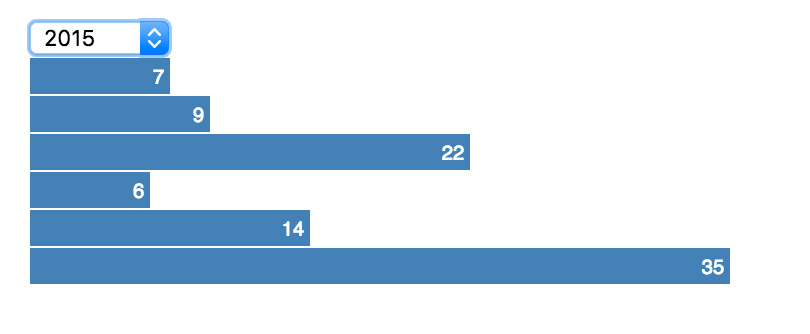
Visualization with Div
Using D3 Events
This example is the same as above, but using the D3 method for events. Instead of using the anonymous JavaScript function to process the dropdown onchange event, it uses the D3 .on event operator. Now the datasets are in individual arrays that are passed into the draw function depending on what is selected in the dropdown. The code to the right provides the same result as above, but uses the D3 technique for the event.
Using D3 Events
Visualization with SVG
Finally, let's chart an SVG shape in our visualization. The code to the right is a comprehensive example that plots data on a SVG rect. It also provides a tooltip that reads the data and transitions. It uses the same technique for events used in the example above.
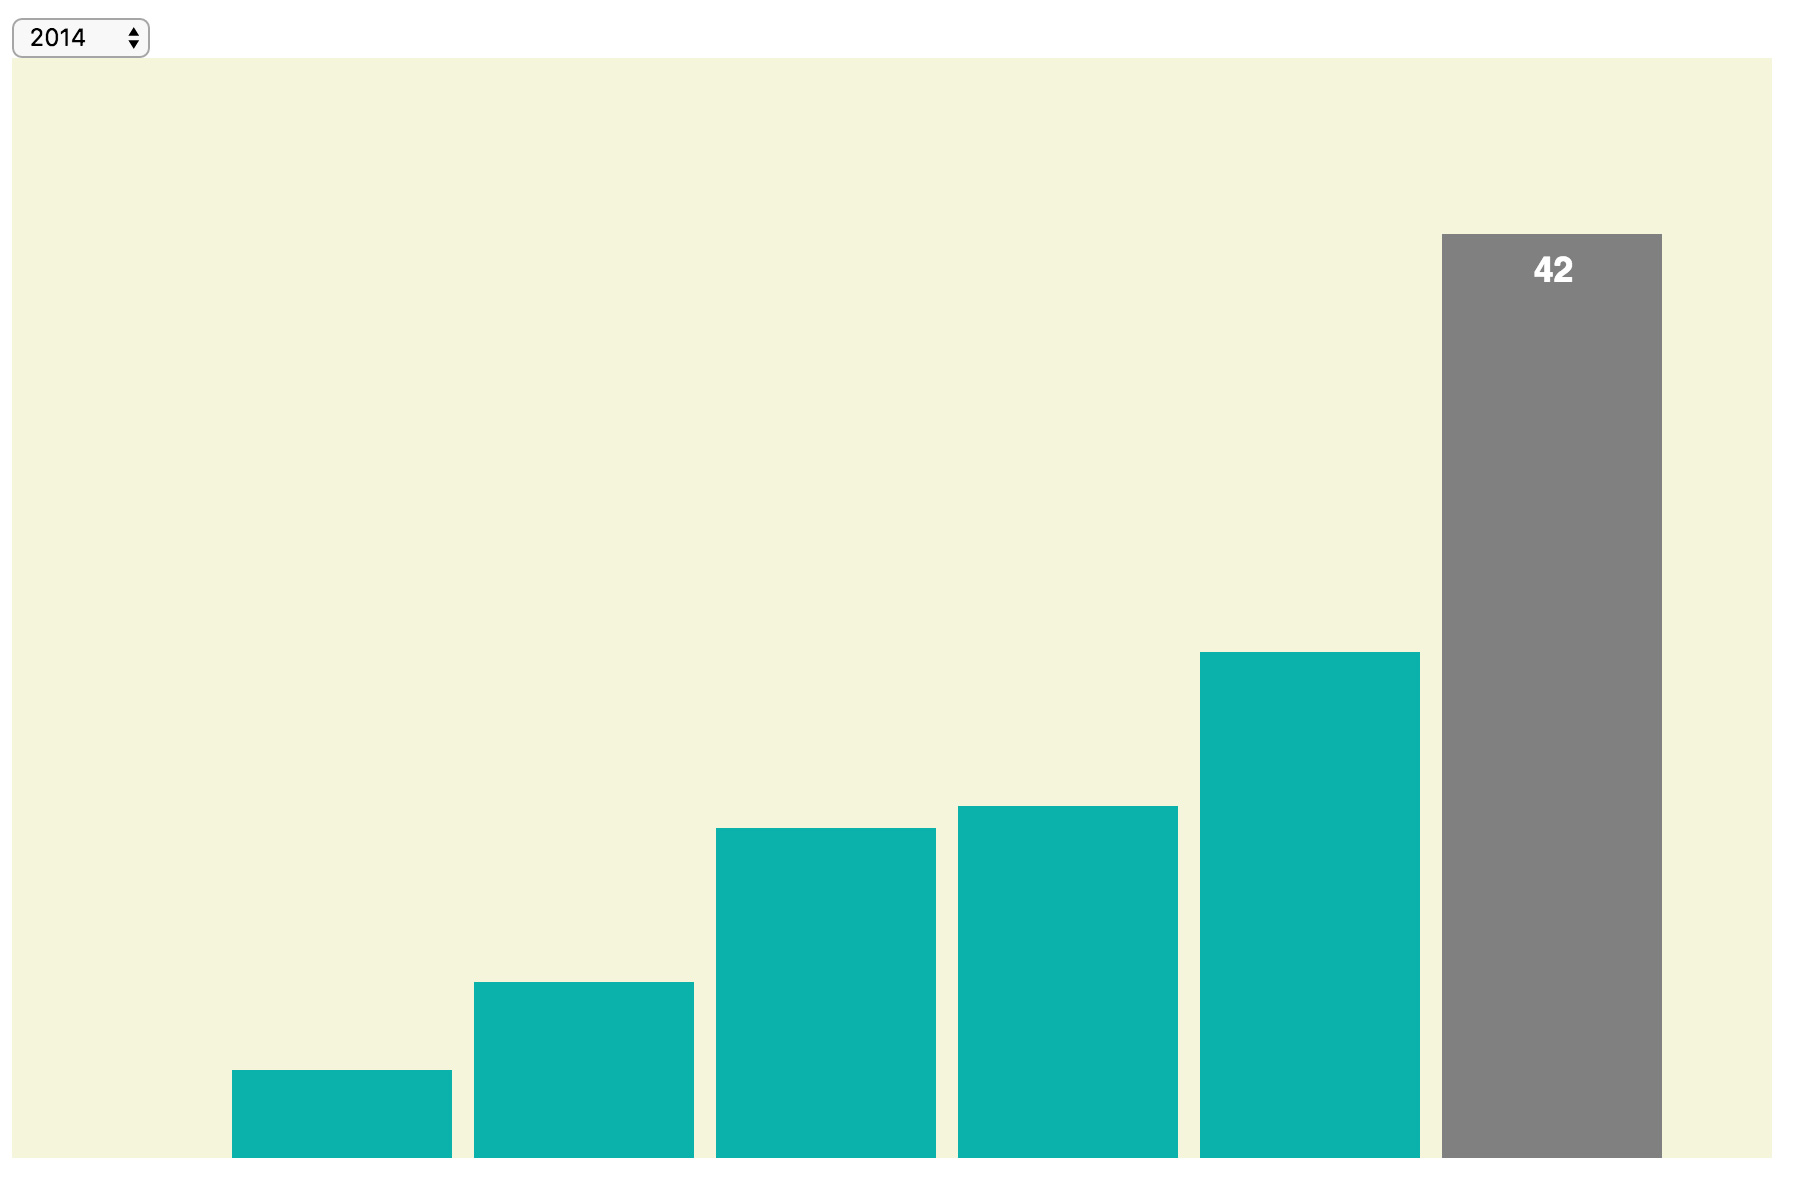
Visualization with SVG
Moving On
This is a quick look at D3. There's a lot more to learn in regard to different charting types and using responsive techniques. You will need lots more practice with it. But now that you understand the basics, you can work with the many D3 code samples provided online. For example, take a look at this sortable bar chart. You can copy the code for this example for the index.html and data.tsv (tab-separated values) files and then modify the values in the data file for your own purposes. This example creates a bar chart and provides an option for clicking a box to sort the values on the chart.